


Experienced traders stick with PrimeXBT because it is a one-stop-shop solution, offering all the advanced trading tools necessary to maximized returns and minimize risk when trading the platform’s over 50+ trading instruments across forex, commodities, stock indices, and cryptocurrencies like Bitcoin, Ethereum, EOS, Ripple, and Litecoin.
Because PrimeXBT has all of today’s hottest markets like the S&P 500, gold, oil, and Bitcoin all under one roof, users can build a diverse portfolio not possible anywhere else. The only reason to ever leave the platform before was if you wanted to access TradingView for the industry-standard in charting software.
As a company that regularly listens to customer requests and seeks to provide all the highest quality tools traders demand, PrimeXBT recently added TradingView integration directly to the platform, so now there’s very little reason to ever to switch windows or exit the platform during a trading session.
We recently took the platform’s TradingView integration for a test drive, and here’s how it performed.
PrimeXBT Brings TradingView TA Directly Its Account Dashboard
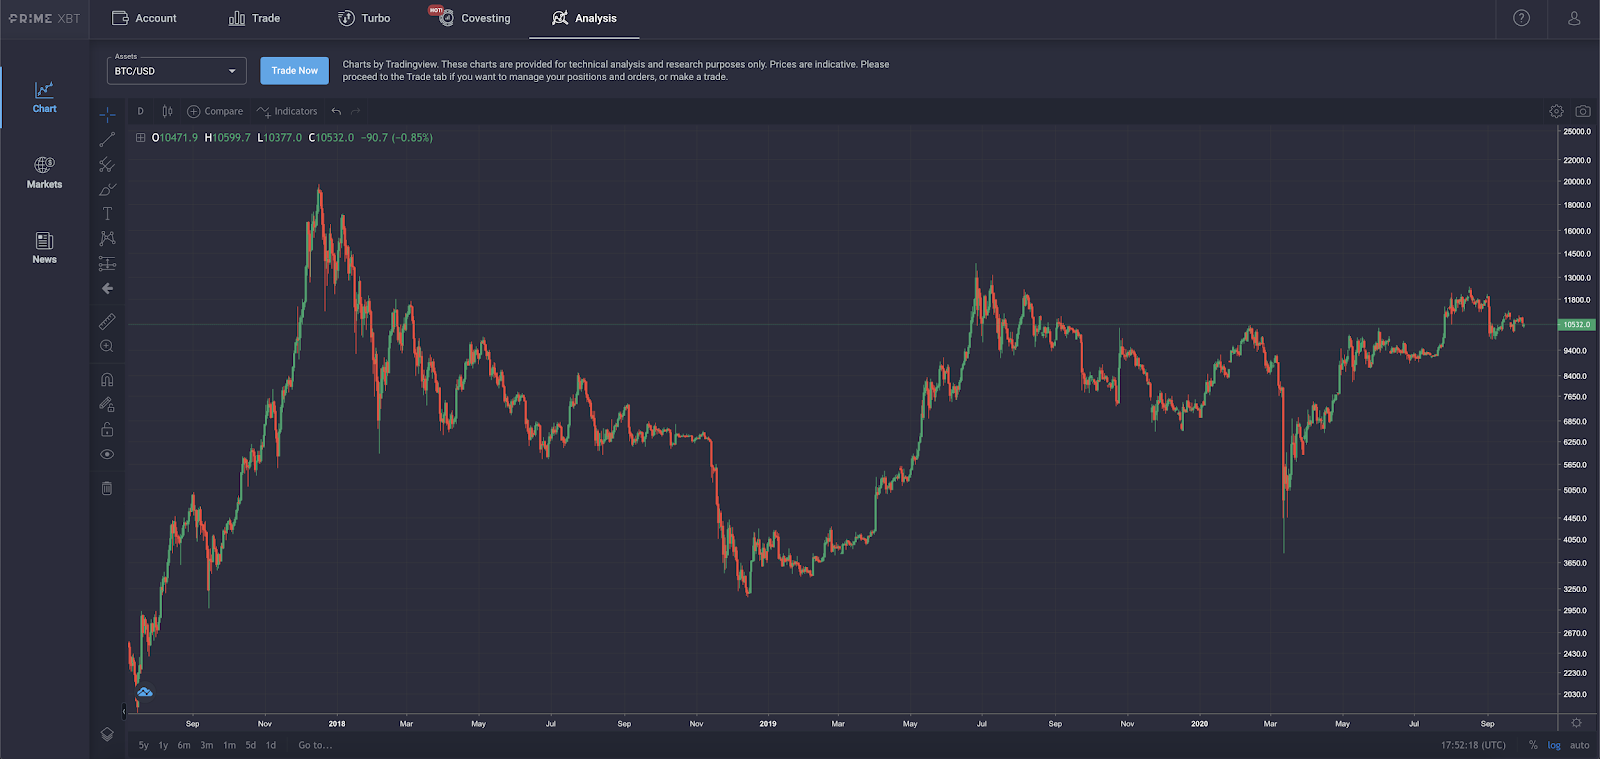
Technical analysis is a critical tool that traders rely on to help predict price action and increase the probability of success and profitability. By drawing trendlines, or finding blocks of support and resistance, potential entry and exit points discovered, a strategy can be developed, and overall results can be improved.
Technical analysis isn’t an exact science, so naysayers are quick to write it off as witchcraft. However, it can drastically improve success rates by finding probable outcomes based on a variety of data, signals, and more.
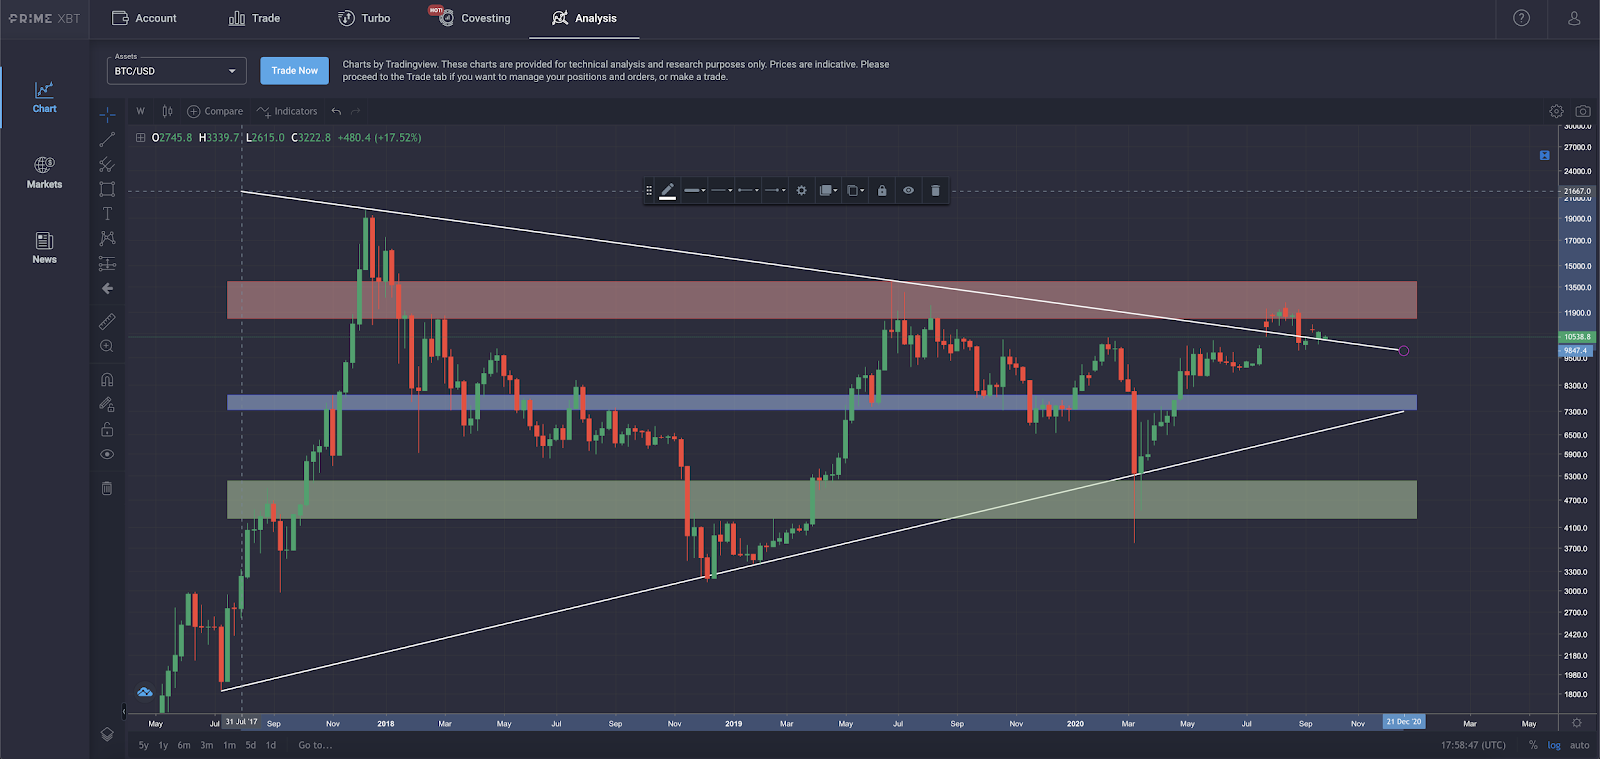
Built-In Indicators And Oscillators Boost ROI Further
PrimeXBT’s TradingView integration comes with an extensive library of technical analysis indicators built-in. The tools offered include popular TA tools like the Bollinger Bands, Relative Strength Index, MACD, Parabolic SAR, Ichimoku, and dozens more.
Learning to read the signals provided by these tools can help back up ideas and confirm chart patterns. For example, a bearish candlestick reversal pattern combined with a bearish crossover of the MACD, right at resistance, is three distinct signs that a trend may be turning around, and a top could be in. Being able to spot these patterns before the rest of the market can potentially provide traders with a competitive advantage.
Plan Long And Short Positions, Then Execute Accordingly
PrimeXBT lets traders long and short any of the CFD-based trading instruments offered on the platform. The TradingView integration can help measure risk to reward ratio, set stop losses, and then long or short accordingly.
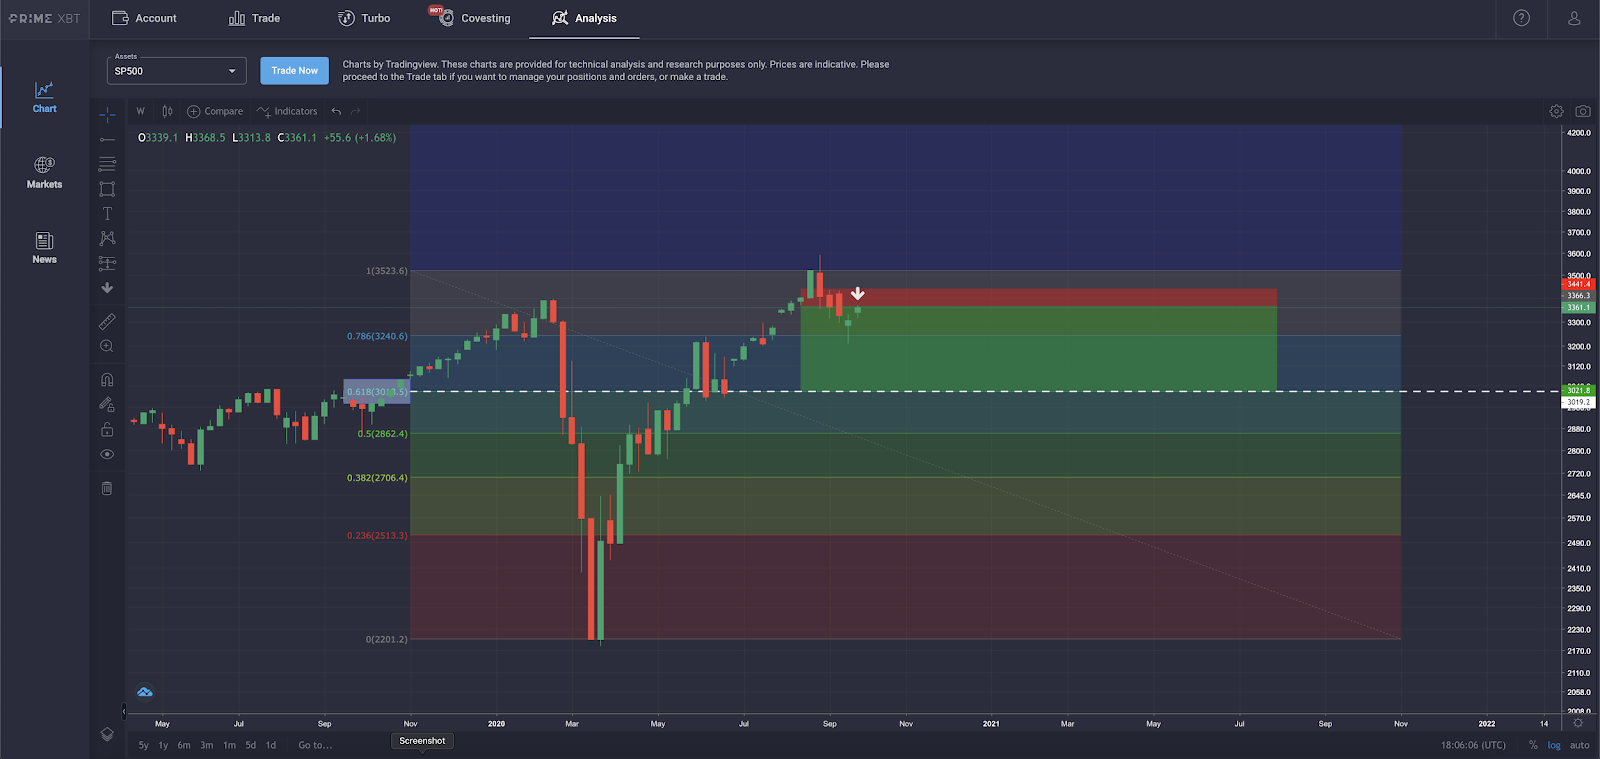
Combining these advanced trading strategies that more experienced traders rely on, along with detailed technical analysis, can lead to substantial results. For example, traders could use the built-in Fibonacci retracement tool to find a target of 0.618, then place their stop loss above the candle where the rejection took place. If the target is reached, the trader will have 4x returns for what they put on the line for risk based on where the stop loss is placed.
Experiment With Unorthodox Tools For Unusual Results
Because TradingView is the top technical analysis software in the industry, and PrimeXBT only provides the very best tools for its traders, all of the unorthodox trading tools are also in tow.
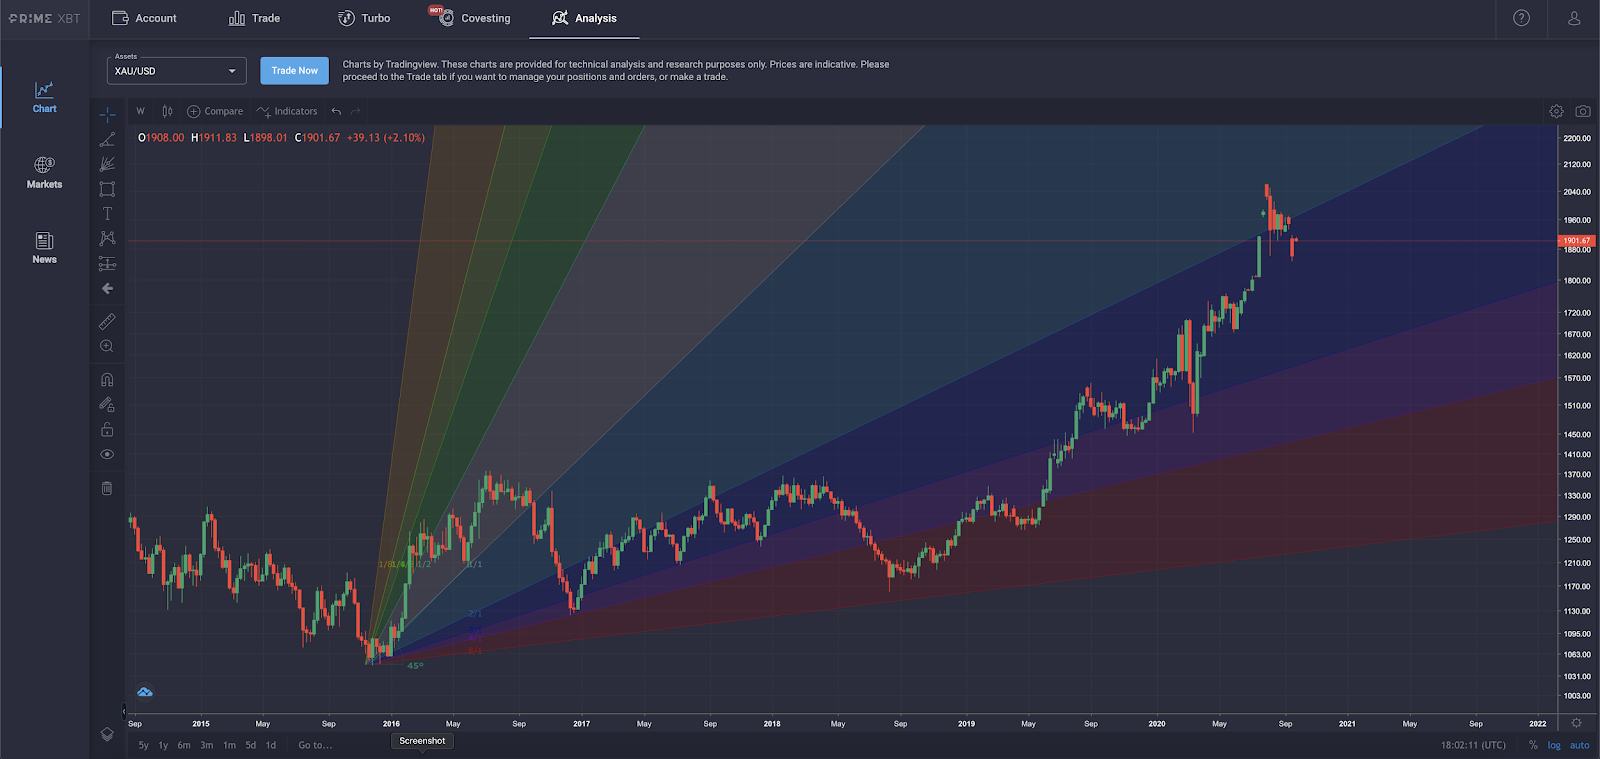
Uncommon tools that traders can experiment with included harmonic patterns, pitchforks, Elliott Wave Theory, and various Gann tools. William Delbert Gann was a legendary trader that used time, geometry, and math to predict markets with incredible accuracy. His tools may appear unusual, but tinkering with them can yield surprising results.
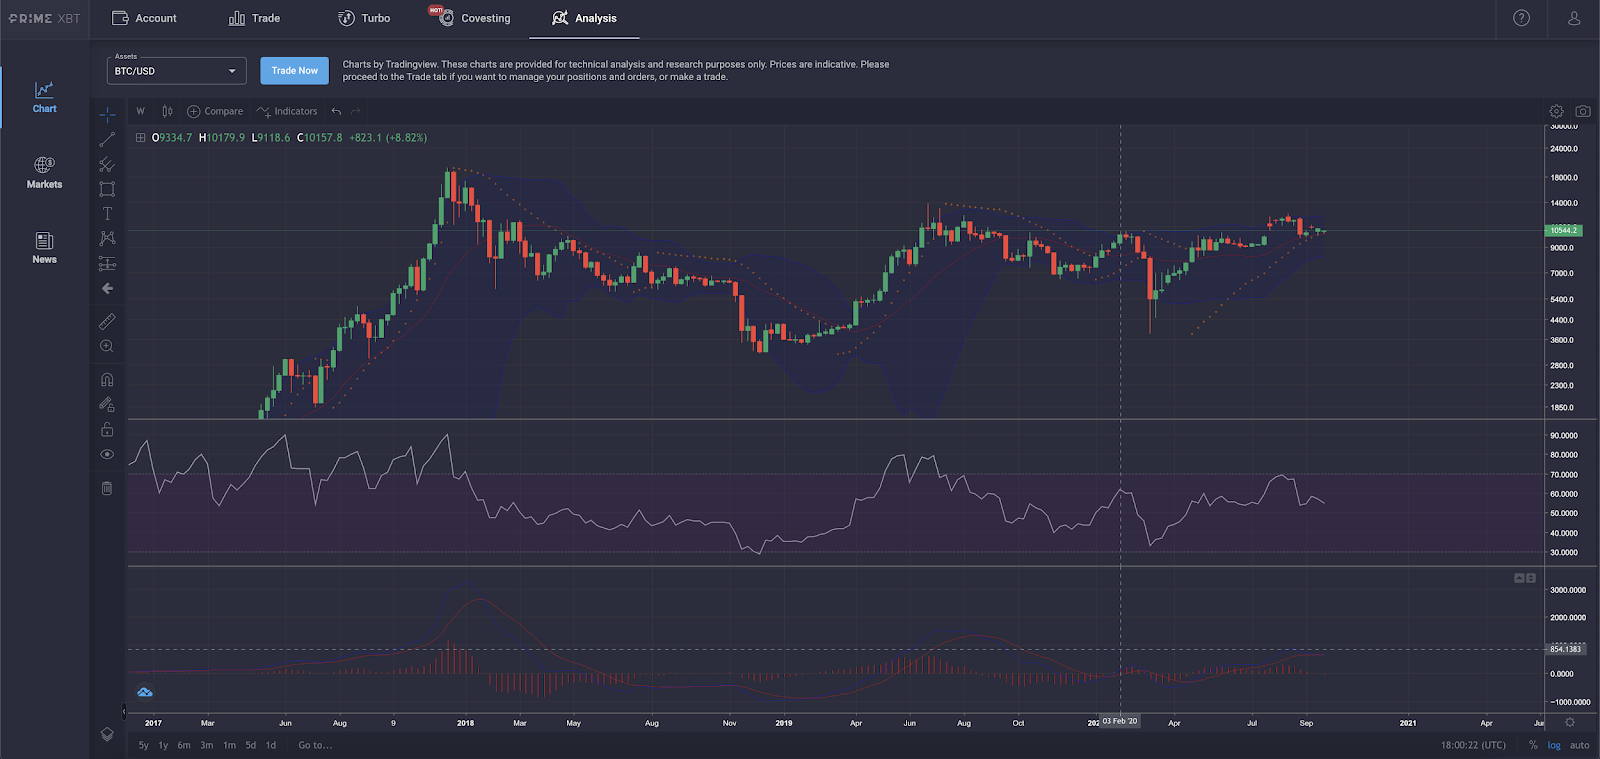
Comparison Charts For Correlations And Sizing Up Performance
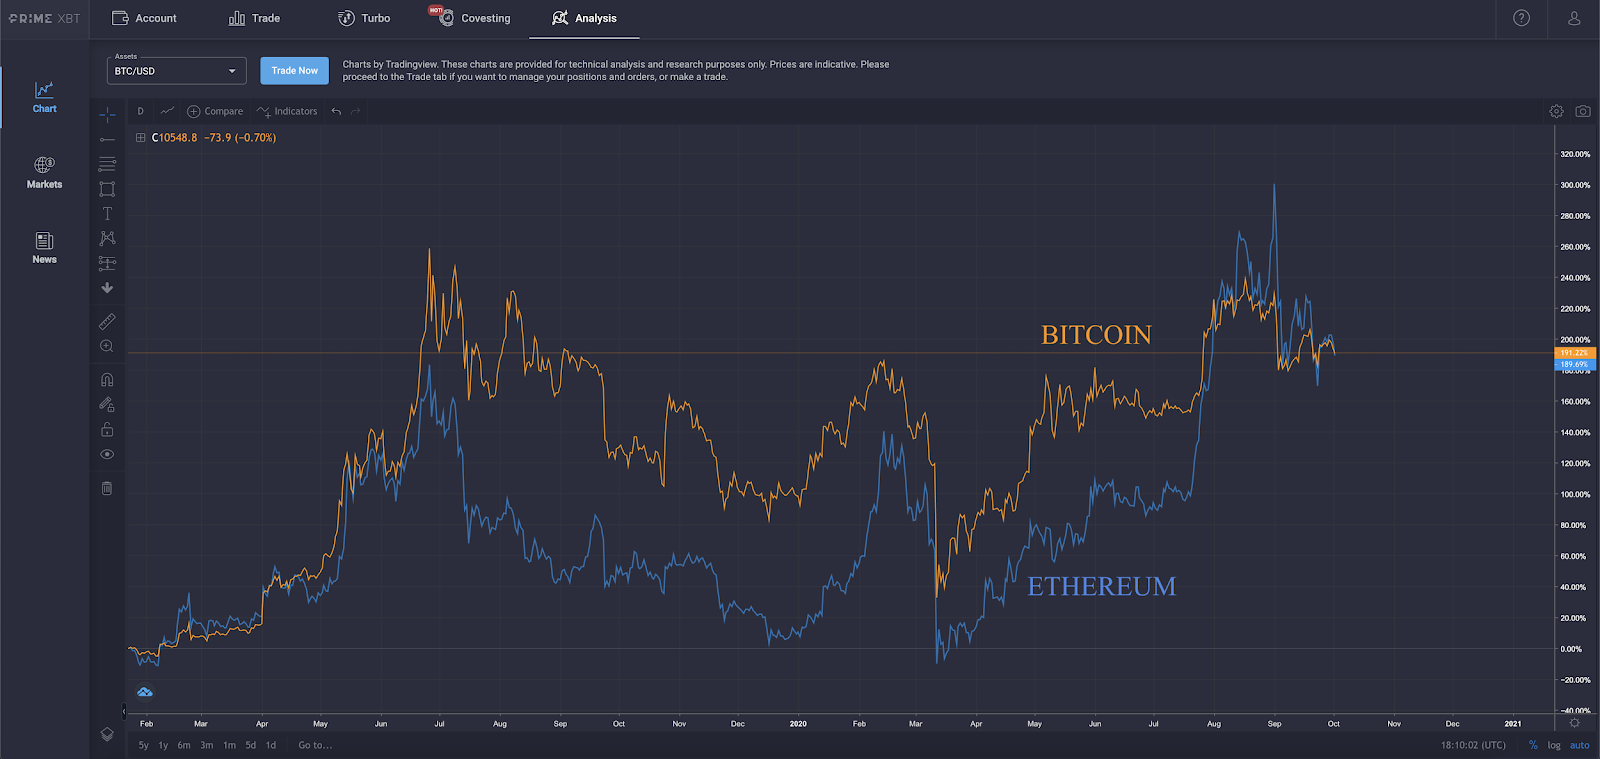
These days, several markets that weren’t previously are showing a tight correlation. For example, Bitcoin was completely uncorrelated to the stock market for its entire existence but is suddenly trading lock and step with the S&P 500. Comparing the two line charts, side-by-side can show correlations between assets.
The performance of similar assets can also be compared, such as the example of Ethereum versus Bitcoin below. Bitcoin had outperformed Ethereum easily in 2019, but in 2020, its been the year of Ethereum so far.
TradingView Technical Analysis Tools Are Now Available On PrimeXBT
Whatever your needs are as a trader, PrimeXBT has you covered – case in point: this new TradingView integration. The platform is also promising an aggregated delivery of up-to-date market news, a trade calculator, event calendar, and much more to assist traders in their day-to-day analysis and continue to cover all aspects of becoming a one-stop-shop.