A monthly digest by the global broker Octa

Overview
August has been a truly historic month for gold (XAU). Despite starting off at an already elevated level after more than a 5% increase in July, gold prices continued to move higher for most of August, setting a new all-time high of $2,531 per ounce (oz) on 20 August.
The month has been packed with major market-moving events (see the list below), which have resulted in a rather bumpy ride for traders. Indeed, gold investors lived through intensifying geopolitical tensions in the Middle East and Eastern Europe, experienced substantial volatility due to a major stock market rout and digested increasingly dovish investors’ interest rate expectations. As many times before, gold has once again proved its underlying value as a safe-haven asset and may continue to shine in the months ahead.
Major market-moving events
- 5 August. U.S. recession worries induced by a disappointing nonfarm payrolls (NFP) report for July shook global markets. U.S. stock indices plunged to almost two-month lows, while Nikkei 225, Japan’s benchmark stock index, recorded its worst two-day decline ever, dropping by 18.2%, exceeding the losses incurred during the 1987 Black Monday crash. The gold market saw substantial volatility as the price of the bullion fluctuated between $2,360 and $2,460 during a single trading session. Although gold managed to recoup some of the losses later, overall, XAUUSD was down 1.5% that day.
- 8 August. Gold rose by almost 2% due to safe-haven demand and growing expectations for a sizable interest rate cut from the U.S. Federal Reserve (Fed) in September. Overall, the market begins to expect more than 100 basis points (bps) worth of rate cuts by the Fed over the course of just four meetings.
- 12 August. Gold price rose another 1.7% ahead of the U.S. Consumer Price Index (CPI) report, while the market continues to price in more than a 50% chance of a 50-basis point (bps) rate cut by the Federal Reserve (Fed) in September. In addition, renewed tensions in the Middle East stimulate more demand for safe-haven assets as traders brace for retaliation by Iran against Israel over the assassination of a Hamas leader in Tehran.
- 16 August. Gold surges more than 2% to a fresh one-month high as much lower-than-expected U.S. housing data puts additional pressure on the greenback, making gold more attractive for holders of other currencies.
- 20 August. The gold price reached a new all-time high as traders continued to bet on imminent interest rate cuts by the Fed while awaiting painful revisions to U.S. payroll data and Jerome Powell’s speech at the Jackson Hole economic conference.
Despite temporary setbacks, gold continued to move higher in August, and the price of yellow metal remained comfortably above its 100-day and 200-day moving averages. Rising expectations for looser monetary policy in the U.S. and globally, endless geopolitical tensions and political instability, and solid structural demand on the part of central banks helped push the bullion’s price to an all-time high. In addition, the technical picture has been positive, resulting in trend buying by investors.
Physical demand for bullion has been a key driver behind the rising price of gold in the financial markets. Just recently, a Hong Kong Census and Statistics Department (C&SD) report showed that China’s net gold imports via Hong Kong in July rose by about 17% from the previous month. Although the data for August has not been released yet, it seems reasonable to infer that China’s purchases probably remained elevated given that the People’s Bank of China (PBOC), China’s central bank, has granted new gold import quotas to commercial banks in anticipation of revived demand. This is important because China is the world’s largest consumer of gold, and its buying patterns can influence the global market and affect prices. In fact, according to the World Gold Council (WGC), PBOC was the world’s largest single buyer of gold in 2023, with net purchases of 7.23 million oz. According to global broker Octa’s estimates, global central banks have added more than 130 tons of gold to their reserves in 2024.
CFTC Commitments of Traders vs Gold Price
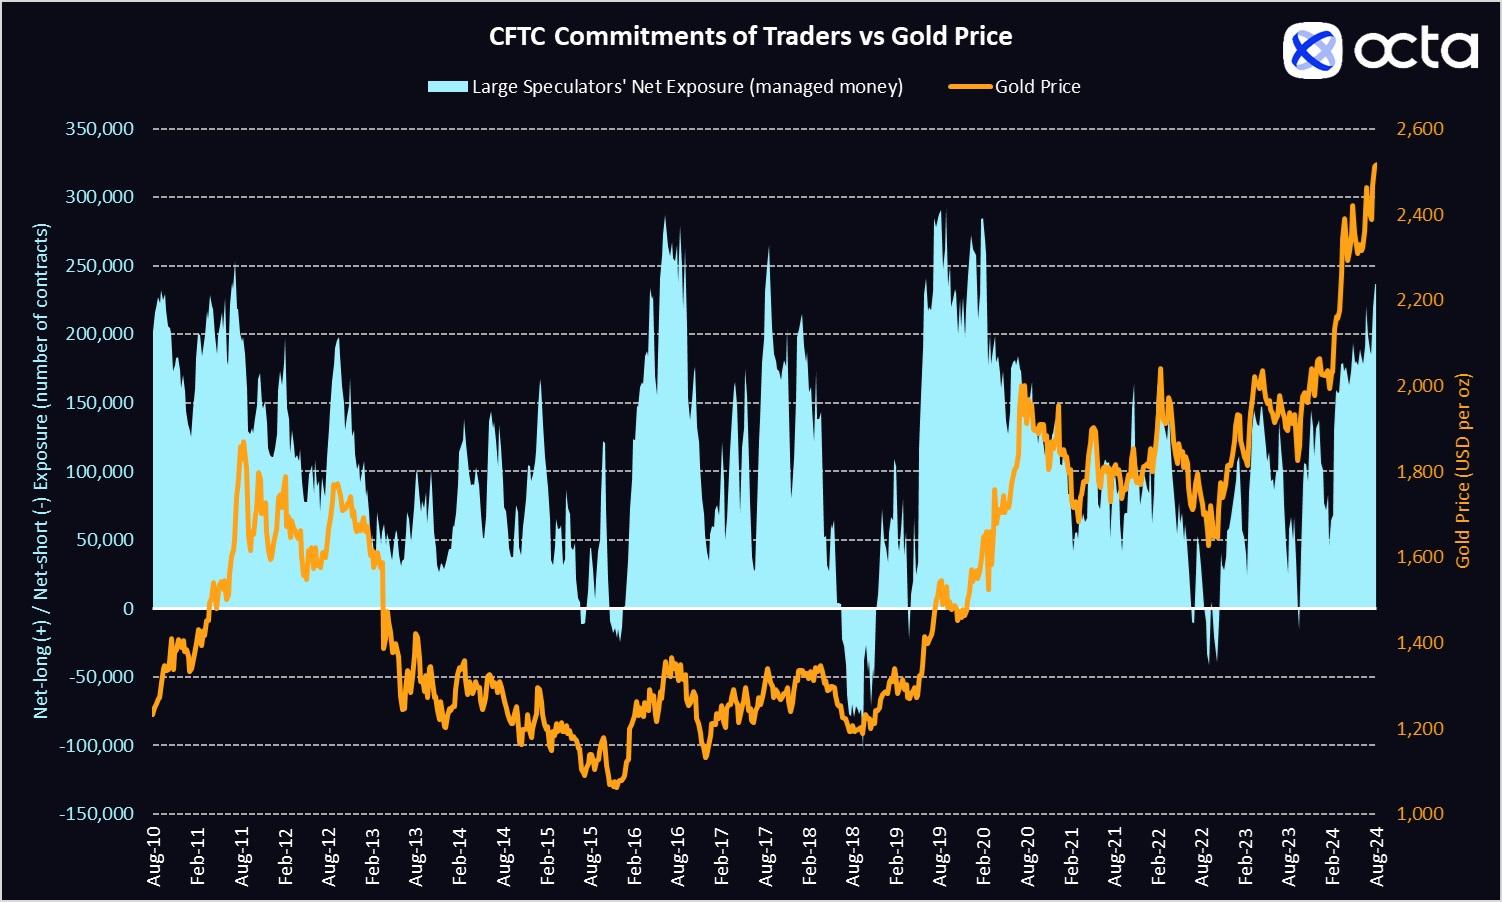
Source: CFTC, LSEG, global broker Octa’s calculations
Apart from central banks, global investors have also remained quite bullish on gold. According to the Commodity Futures Trading Commission (CFTC), large speculators (leveraged funds and money managers) increased their net-long exposure in COMEX gold futures and options by 47,909 contracts in August to 236,818 net-long contracts. They have maintained their largest net-long exposure in gold in more than four years. According to LSEG, a financial firm, physically-backed gold exchange-traded funds (ETFs) witnessed their third consecutive monthly inflow in August––21.94 tons.
Gold ETF Monthly Flows
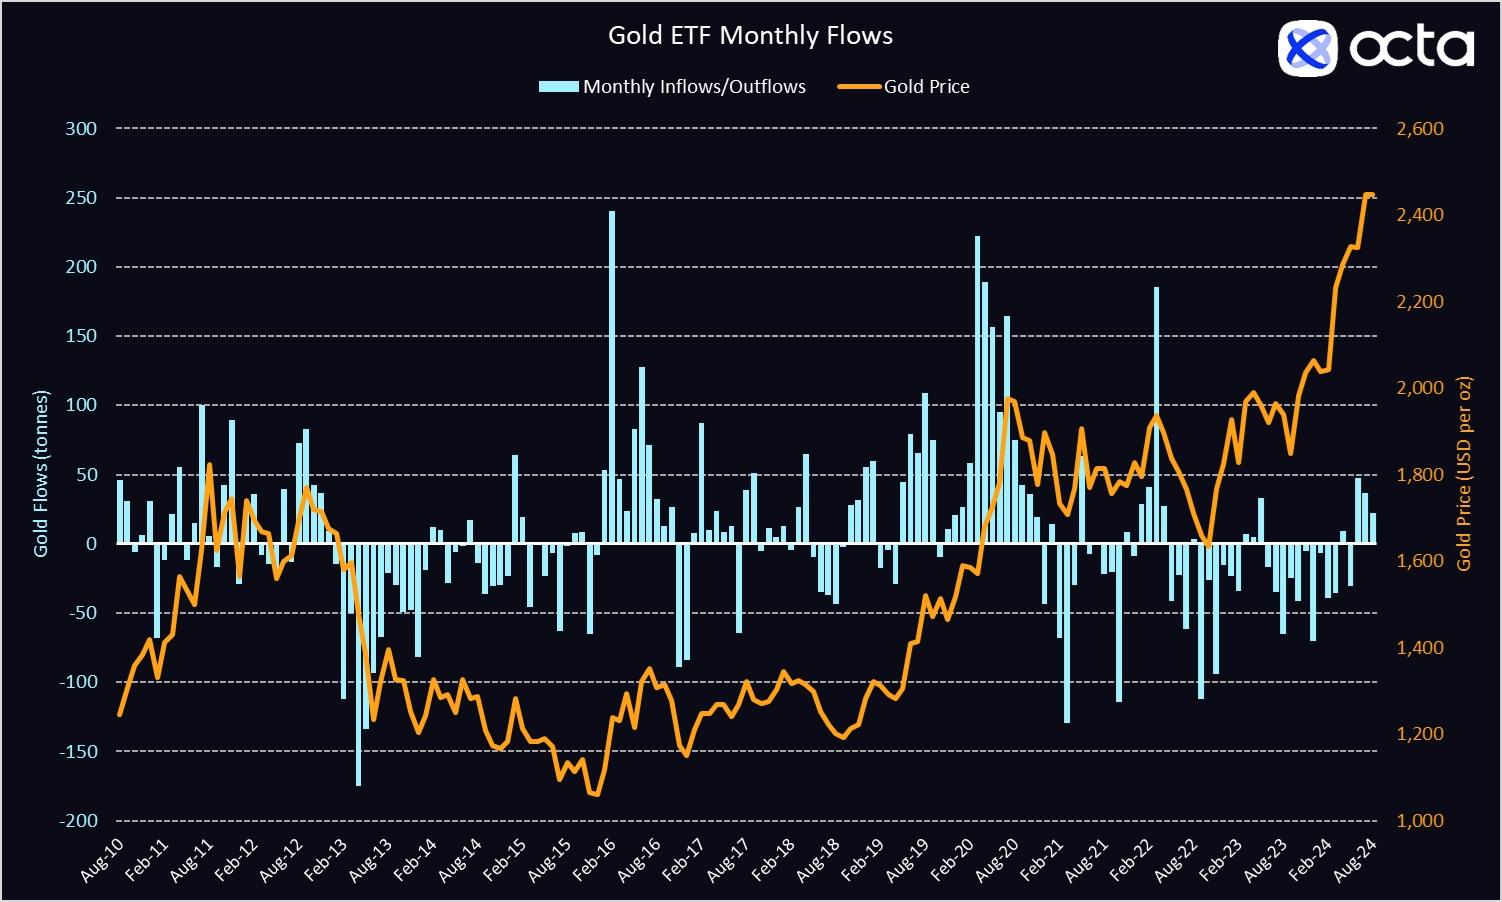
Source: LSEG
A special section: gold vs Bitcoin
The competition between gold and Bitcoin has been a hot topic in the financial services industry for years. Both assets have their own unique appeal to investors, yet they represent very different approaches to wealth preservation and capital growth. Both assets are viewed as hedges against inflation but in slightly different ways. Gold’s value has historically been tied to its ability to hedge against currency depreciation and inflation. On the other hand, Bitcoin is often seen as a hedge against the uncontrolled emission of fiat currencies thanks to its fixed supply of 21 million coins. However, Bitcoin’s shorter history makes it less predictable in this role than gold.
Gold and Bitcoin respond differently to increasing global risks, including geopolitical conflicts and economic recessions. When global stability is disrupted, gold tends to rise, while Bitcoin, which often correlates with U.S. indices such as the S&P 500 and NASDAQ, tends to decline. This is because Bitcoin is considered a high-risk, high-reward asset and is usually sold off first when the risk-off sentiment hits the markets. Investors then shift their funds into more reliable and less volatile assets. In fact, August has vividly demonstrated this relationship, as gold increased by 2.2% during the month, while Bitcoin price dropped by 8.5%. However, Bitcoin has outperformed gold year-to-date (y-t-d), gaining 44% (see the chart).
Relative Performance of Key Financial Assets in 2024
(December 29, 2023 = 0)
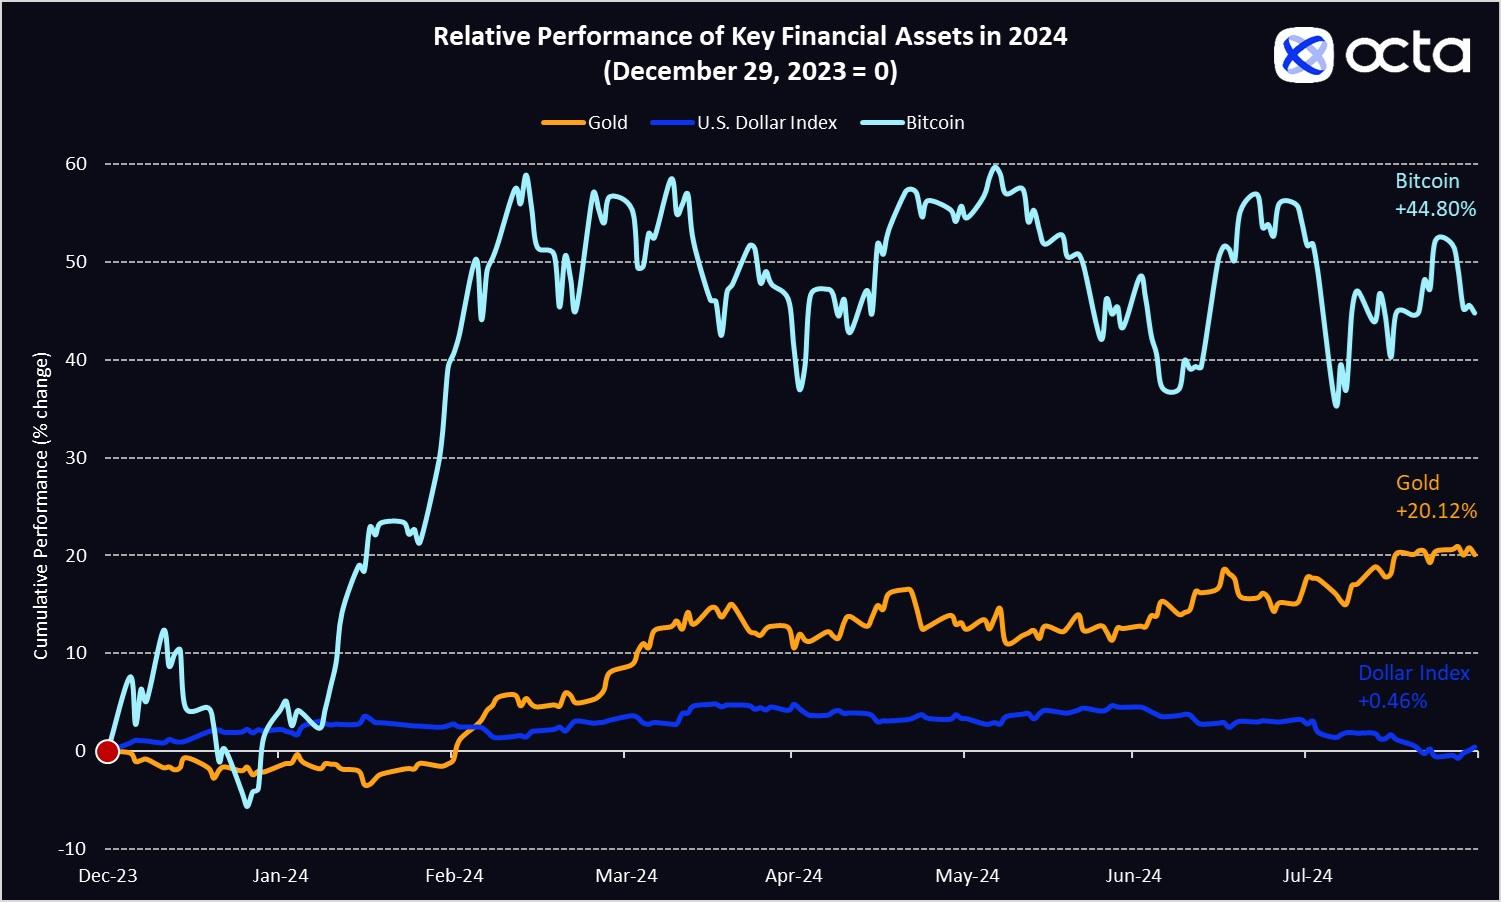
Source: LSEG
Over time, this situation may change as Bitcoin gains credibility among institutional investors. Several Bitcoin ETFs were launched earlier this year, which have begun to reshape the cryptocurrency market. Specifically, ETFs reduce Bitcoin’s volatility as demand becomes more stable. Moreover, Bitcoin ETFs compete with Gold ETFs for investors’ funds.
According to The Block, a crypto research portal, in August 2024, inflows into BTC ETFs exceeded $200 million, bringing the total since their launch close to $60 billion. For comparison, the total assets under management (AUM) in gold ETFs amount to approximately $90 billion. ‘If this trend continues, Bitcoin ETFs could surpass gold ETFs by the end of the year. In the long term, competition with Bitcoin is likely to exert bearish pressure on gold prices,’ said Kar Yong Ang.
Outlook
Fundamentally, the outlook for gold looks bright. We have singled out three important bullish factors that will continue to play out in September 2024.
Global monetary policy
Gold is priced in U.S. dollars and is therefore highly sensitive to changes in U.S. interest rates, inflation, and the greenback’s value. As already mentioned, the market is positioned for a dovish Fed. In fact, the latest interest rates swap market data implies roughly 220 bps worth of rate cuts by the Fed by the end of December 2025. This means the market expects the U.S. central bank to cut the borrowing costs in half over the next five quarters. It is widely expected that other central banks will not fall far behind. Investors expect the European Central Bank (ECB) to deliver three quarter-point rate cuts by the end of January 2025, while the Bank of England (BoE) is anticipated to announce at least two rate cuts of 25 bps each before the end of February 2025. Fundamentally, a tighter (or looser) monetary policy worldwide is a major bullish factor for gold. Because gold has no passive income and does not pay any interest, the opportunity cost of holding it becomes lower when central banks reduce their policy rates. The main risk is, of course, inflation. Should it remain above central banks’ targets or, even worse, start to increase, the Fed and its counterparts will be forced to hold the rates higher for longer.
Geopolitical uncertainty
The conflicts in the Middle East and Eastern Europe, such as the Israel-Hamas hostilities, the Red Sea crisis, and the ongoing tensions between Russia and Ukraine, have destabilised world politics and raised many fears ranging from oil and food supply disruptions to the prospect of a worldwide conflict. Gold, considered a ‘safe-haven’ asset, typically sees increased demand during political uncertainty and instability. While it is extremely difficult to project the resolution of geopolitical conflicts, let alone to forecast the emergence of new ones, peace negotiations in the hottest regions are yet to commence. ‘Until there is a clear path to stability, investors would prefer to err on the side of caution and will simply buy gold ‘just in case’. Nobody wants to be caught shorting the bullion when the news of another military incident here or there hits the newswires’, says Kar Yong Ang, global broker Octa analyst.
The upcoming U.S. elections further complicate the global political landscape, adding another reason for gold prices to keep rising. Due to its safe-haven status, gold typically experiences increased buying interest during electoral volatility. Historical data indicates that on a micro level, gold prices tend to rise in the months leading up to an election and may continue to do so if the election results are contested or lead to significant policy shifts.
China and India
Physical demand for gold may continue to increase thanks to China and India, two major gold consumers. Specifically, China has seen its national currency, renminbi (RMB), appreciate more than 2% over the past month. This is not a welcoming development for a country whose economy heavily depends on exports. Thus, Chinese authorities may relax gold import quotas to stop the yuan from appreciating too much. As a result, the physical and investment demand for gold in China may rise in the months ahead.
Retail demand in India will probably remain robust following the government’s decision to cut import duties on gold and silver from 15% to just 6%. This decision comes ahead of the Indian festive season (October – March) and may boost jewellery consumption in the country.
Technical picture
From a technical perspective, during a 4-hour timeframe, we observe the first signs of weakness. RSI signals bearish divergence, and the growth rate has slowed down. Despite the bullish trend in gold in general, the price may decline towards the 2,475.00 support level. At this level, the ascending trend line and a 200-day moving average will act as support. Since the trend is generally bullish, the price may renew the maximums after a mild correction. If the price fails to hold the 2,475 level, it may drop towards 2,360–2,400 (dashed arrow on the chart).
Gold Technical Chart (4-hour timeframe)
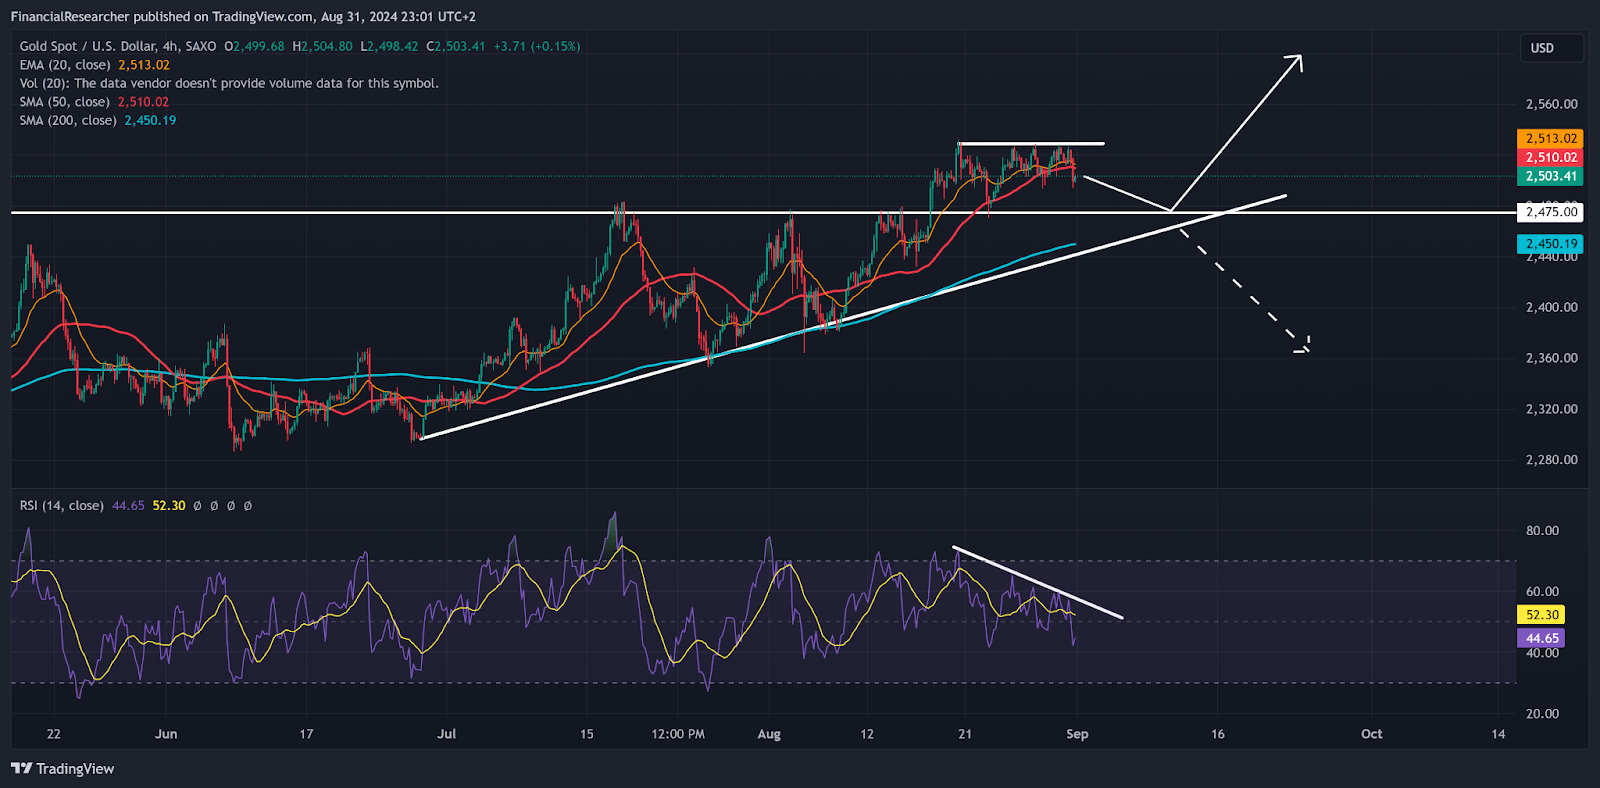
Source: Trading View, global broker Octa
On a weekly timeframe, we also see a bearish divergence and a possible bearish wedge formation, which may become highly negative for gold prices. However, it doesn’t necessarily mean that the price will drop immediately. Firstly, the price may correct towards the 20-week exponential moving average, rebound to test the 2,600 level, and then pull back towards the 2,400 level by the end of the year. By this time, the 50-week moving average is expected to be near the 2,400 mark, which may provide a new long-term entry point for gold buyers.
Gold Technical Chart (1-week timeframe)
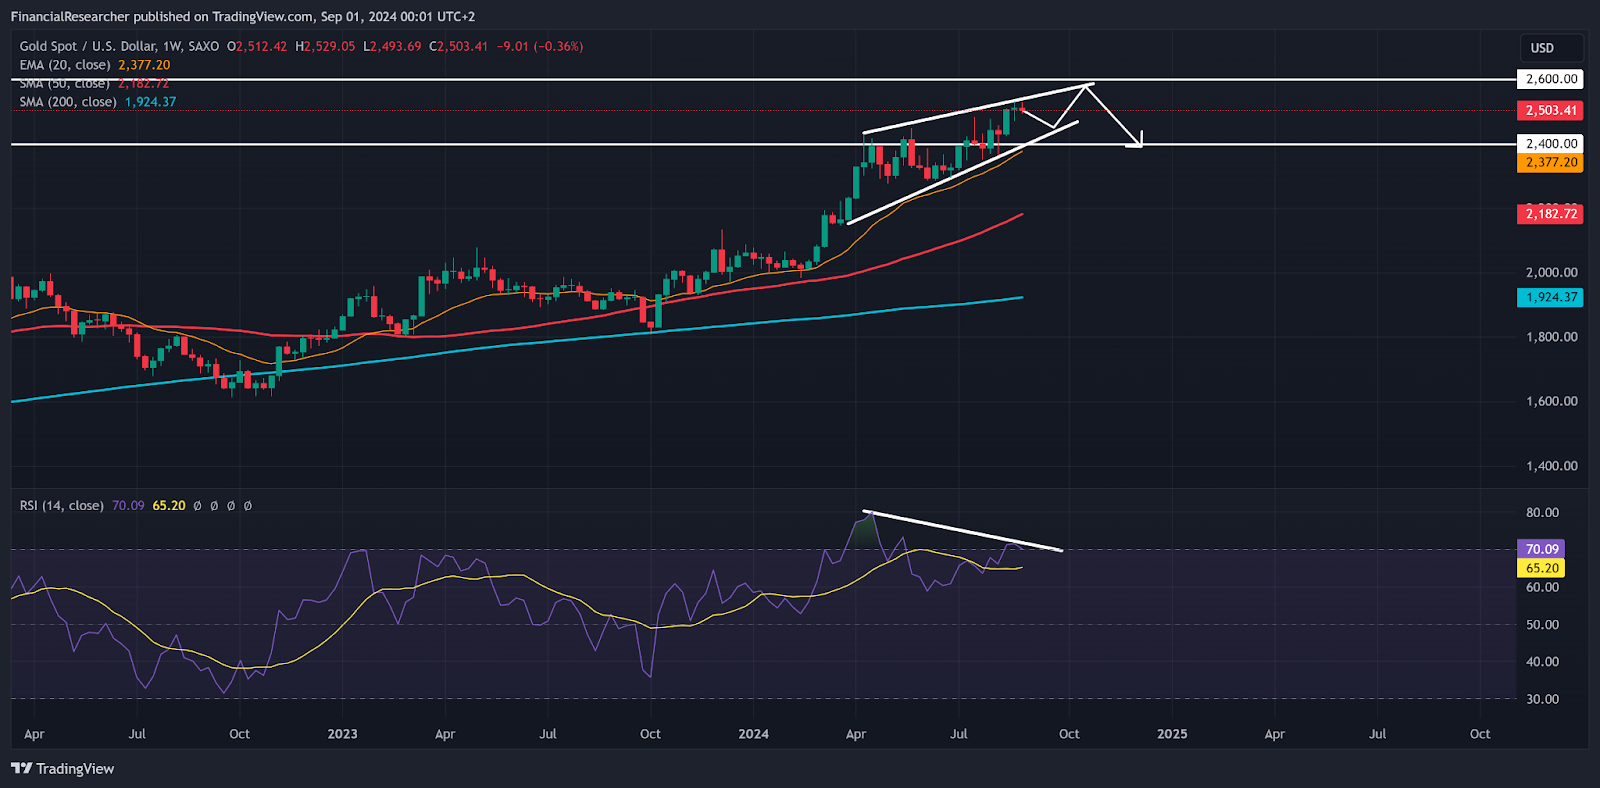
Source: Trading View, global broker Octa
Conclusion
Overall, we see a mixed picture. Fundamentally, gold is a ‘screaming buy’, but technicals suggest that a short-term correction is likely. Gold is looking to test $2,600 and may move towards $3,000 in 2025. However, technical analysis indicates that the price may reach these highs only after a healthy bearish correction.
‘There are so many reasons for the gold price to continue rising in September, that the largest risk for gold bulls seems to be pure complacency. Too many bullish factors are already priced in. If investors start speculating that something is not playing out as planned they may sharply reduce their net-long exposure leading to a major sell-off in gold prices. This is not our base scenario as we believe that gold will continue to trend higher slowly, but we must prepare for periods of above-normal volatility and could see sharp downward corrections. A road to $2,600 per ounce will not be an easy one’, said Kar Yong Ang, global broker Octa analyst.
Key Macro Events in September (scheduled)
| Bank of Canada meeting | 4 September |
| U.S. nonfarm payrolls | 6 September |
| U.S. Consumer Price Index | 11 September |
| European Central Bank meeting | 12 September |
| U.S. Consumer Sentiment Index | 13 September |
| Federal Reserve meeting (decision, projections, and dot plot) | 18 September |
| Bank of England meeting | 19 September |
| Bank of Japan meeting | 20 September |
| S&P Global Purchasing Managers Indices | 23 September |
| Reserve Bank of Australia meeting | 24 September |
| Swiss National Bank meeting | 26 September |
| U.S. Personal Consumption Expenditure Price Index | 27 September |
CHARTS PACK
Relative Performance of Key Financial Assets in 2024
(December 29, 2023 = 0)
Source: LSEG
CFTC Commitments of Traders vs Gold Price
Source: CFTC, LSEG, global broker Octa calculations
Gold ETF Monthly Flows
Source: LSEG
Gold Technical Chart (4-hour timeframe)
Source: Trading View, global broker Octa
Gold Technical Chart (1-week timeframe)
Source: Trading View, global broker Octa