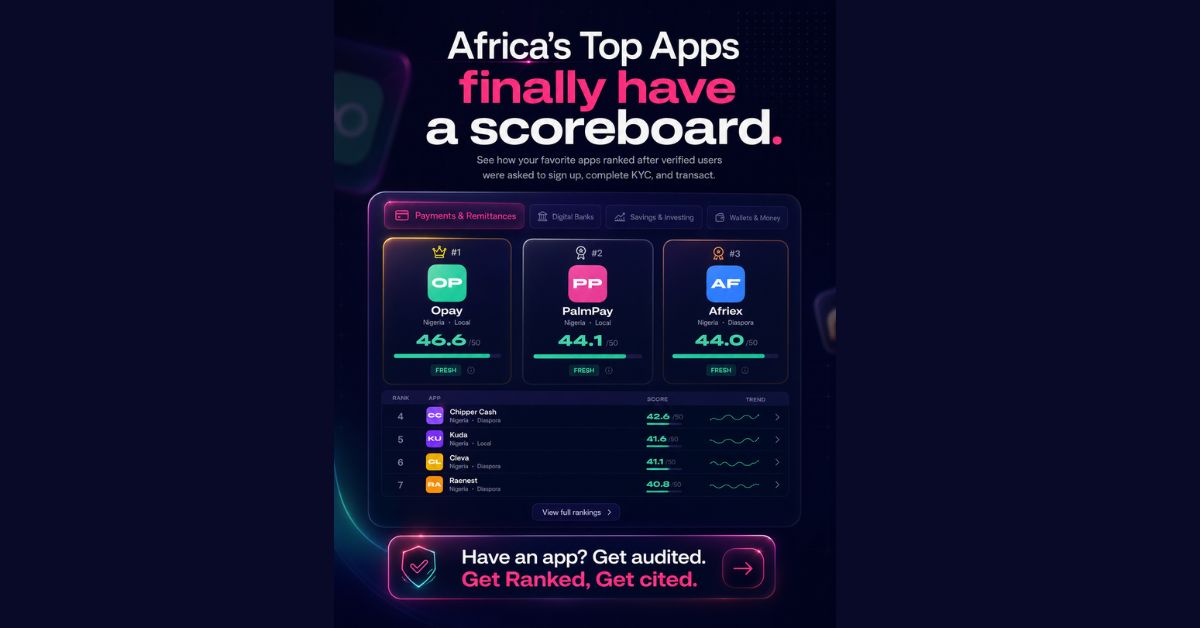
Ten apps. Two hundred verified users. Five performance dimensions. The first time Africa’s top fintech apps have been measured on the same scale.
If you ever wanted to know how OPay’s signup-to-transfer flow compared against PalmPay’s, or whether Afriex held its own against Chipper Cash on user experience, the honest answer was a shrug. Star ratings on the Play Store captured support complaints, not product quality. Pitch decks claimed “best UX” without evidence. The category is scaling past the point where reputation can substitute for data.
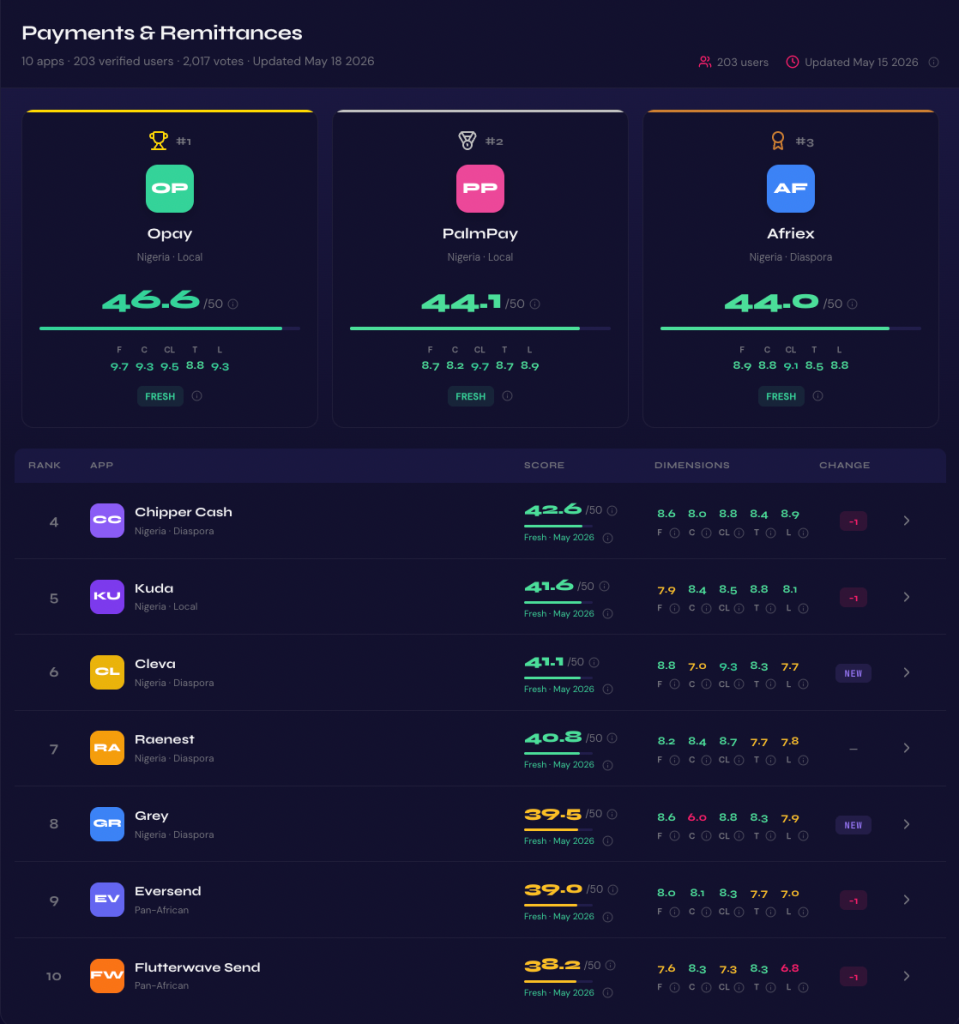
The FOLIO Fintech Performance Index changes that. FOLIO is a market research platform with 50,000+ verified users across Africa and the diaspora. Its Fintech Performance Index currently benchmarks 10 of Africa’s most-used payments and remittance apps, using 20 verified users per app across five dimensions: Friction, Cost, Clarity, Trust, and Likelihood to return.
That is over 200 users completing comparable flows, with every app measured on the same objective scale.
Who is this for
For founders, investors, and product teams, FOLIO turns product performance into a benchmark: a credible, third-party ranking that can be used for competitive intelligence, investor conversations, and media visibility.
If you’re a consumer startup competing in this market, you can get your app audited, ranked, and cited in FOLIO’s performance index alongside category leaders today.
The current standings:
How the scoring works
Every app on the index is scored the same way. Twenty verified users from FOLIO’s panel of 50,000-plus African and diaspora users complete the full signup-to-transfer flow on the app: real account creation, real KYC, real funding, real transfer attempt. Screen recordings are required as proof.
After completing the flow, each user answers two questions per dimension. The first asks what they think most users would say about the app. The second asks what they personally experienced. FOLIO calls these Perceived Consensus (PC) and Personal Preference (PP).
The two-question structure is what makes the responses honest. Users asked directly how a product performed tend to give the answer they expect to be socially acceptable, especially when the app is popular or well-marketed. Asking what they think the crowd would say first lets them anchor on social expectation. Asking what they personally experienced second exposes the gap. That gap is where the diagnostic value lives, and it is what surveys built on a single Likert-scale question consistently miss.
Composite scores are weighted across five dimensions: Friction, Cost, Clarity, Trust, and Likelihood to return.
Where the leaders stand
Opay (46.60) holds the top of the index by a narrow margin. Its Friction score (9.65 out of 10) is the highest in the category: the signup-to-transfer flow is rated fast and effortless by 85% of verified users. Trust (8.80) is its weakest dimension, and the diagnostic explains why. When users were asked what builds confidence in Opay, the predicted answer was speed and reliability of transfers. In personal experience, “reviews from other users” tied with speed. Opay’s trust mechanism is not only the product itself. It is the social proof around the product. A vulnerability that does not show up in the public app store reviews.
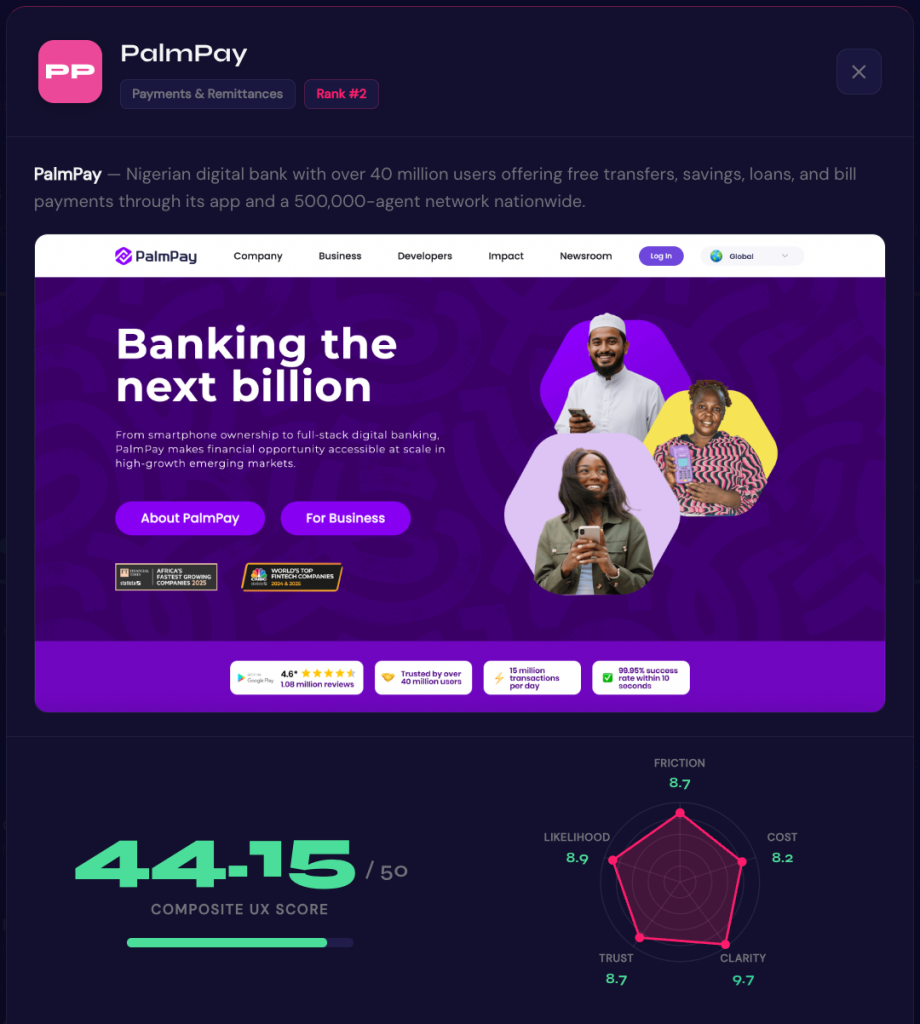
PalmPay (44.15) sits in second, 2.45 points behind. Its Clarity score (9.70) is the highest single-dimension score in the entire index: the clearest signup-to-transfer instructions of any audited app. Where it gives back ground is on Cost (8.20). On the Trust dimension, PalmPay caught what the FOLIO methodology calls a winner swap. Voters predicted “mostly confident with minor doubts” would dominate (45%), but personally rated themselves “fully confident, no concerns” (55%). PalmPay’s users feel more trust than the market gives them credit for. The product is doing better than the conversation about it.
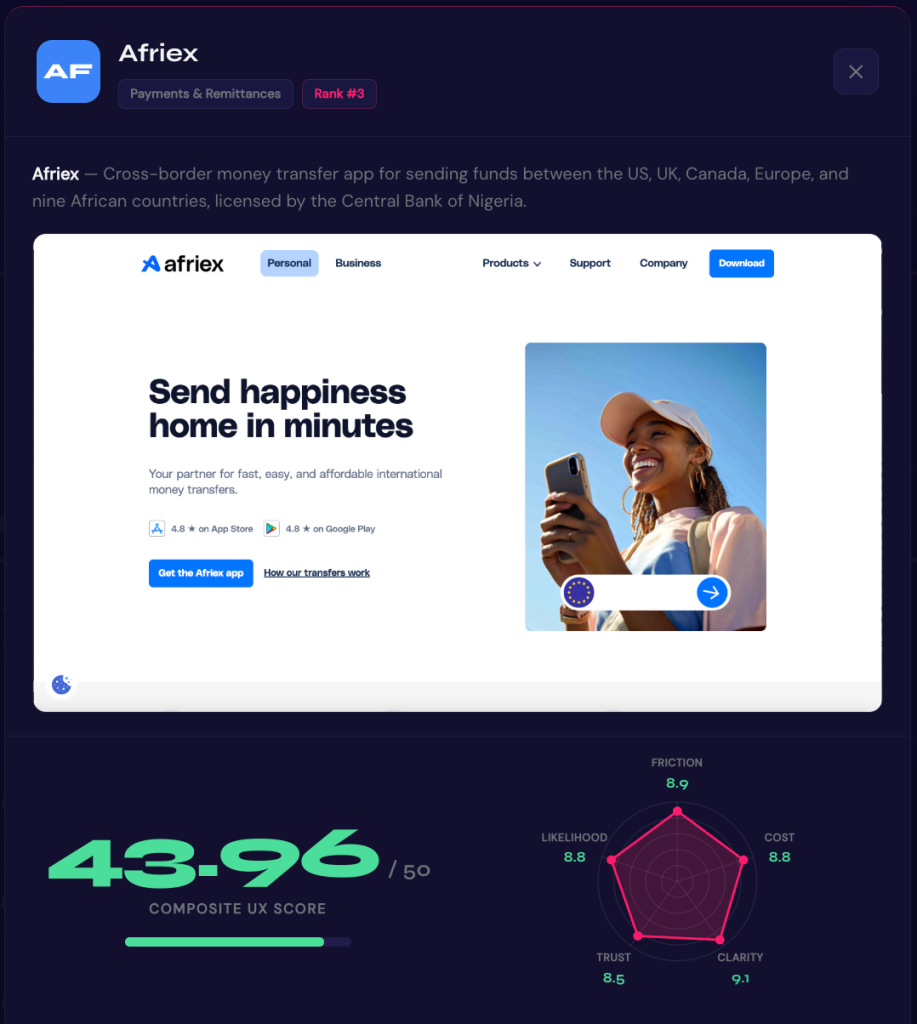
Afriex (43.96) is the surprise of the top three. A diaspora-first remittance app holding its own against locally dominant wallets like Opay and PalmPay. Its Clarity score (9.10) is the third-highest in the category. The local-versus-diaspora divide that has shaped fintech investment theses for the past five years does not translate into a UX divide. The market is segmenting on what users prioritize, not on where the app was incubated.
Chipper Cash (42.60) scores evenly across dimensions, with no single weak spot but no single dominant strength either. The audit caught a meaningful Cost diagnostic: users predicted that fees would first be noticed at the final confirmation screen (40%). In personal experience, only 30% reported that. Fees got noticed earlier, when users were setting up the transfer. The implication for product teams: where you place fee disclosure matters more than how transparent the fee itself is.
Kuda (41.65) ranks fifth overall, but its Trust score (8.75) is the second-highest in the entire index. The product is more trusted than its rank suggests. The composite is held down by Friction (7.90 out of 10). Kuda’s reputation as Nigeria’s most trusted digital bank survives the friction. The question is how long that holds if competitors close the trust gap while keeping their flows faster.
Cleva (41.10) is the new entrant proving USD virtual accounts can compete on UX with legacy players. Its Clarity score (9.35) sits between Afriex and Kuda. Where Cleva is genuinely vulnerable is Cost (7.00). The diagnostic shows why: 55% of users said they first noticed fees only at the final confirmation screen, the highest “surprise fee” rate in the audit.
Raenest (40.80) scored its strongest dimension on Clarity (8.70). But its Trust score (7.70) and Likelihood (7.75) are the lowest of any top-7 app on those dimensions. For a freelancer-focused USD product, this matters. The audience is making cross-border decisions partly on whether the platform will hold up across continents and time zones.
Grey (39.50) has a Cost problem the audit names directly: 5.95 out of 10, almost two full points below the next-lowest score on that dimension across the entire index. Among all 50 dimension scores across all 10 apps, this is the only one that crosses below 6. Whatever Grey is doing on pricing perception, no other app in the category is doing it.
Eversend (38.95) and Flutterwave Send (38.20) share the most strategically dangerous weakness in the index. Both score below 7.00 on Likelihood to return. For each, the diagnostic surfaces the same root cause: “I would prefer to use a competitor app.” These two apps are not losing on product. They are losing to better-rated competitors in this same index.
What this tells us about African fintech
Eight points separate the top app from the bottom. The leaders are not separated from the followers by feature scope. They are separated by execution on specific moments: KYC, fee disclosure, transition timing, confirmation flow. The middle of the pack is tightly clustered. Most apps are within five points of each other.
Trust, not transfer speed, is increasingly the battleground. Three of the top four apps name Trust or Cost as their weakest dimension. The race to the bottom on fees has plateaued. The race to feel safer has begun.
And the local-versus-diaspora divide that has shaped investor theses for African fintech is not a UX divide. Diaspora apps (Afriex, Chipper Cash) sit in positions three and four. The market is segmenting on what users prioritize, not on where the app was built.
Explore the full Fintech Performance Index at foliobusiness.com/rankings.
What’s next
The Performance Index expands quickly. Over the coming months, new rankings will go live for additional fintech subsectors such as Savings and Investing, Lending and Credit, Wallets and Mobile Money, and Insurance. Beyond fintech, we’ll introduce indexes for E-commerce, Delivery, and Transportation apps. Every new category is an opportunity for an up-and-coming startup to plant a flag before the incumbents do.
The apps that get audited first define what the category looks like to founders, investors, and journalists trying to understand it. They become the reference points other apps are measured against. They get cited in the next round of editorial coverage. They get pulled into the next investor’s competitive landscape slide.
For startups still building visibility, the next ranking is being assembled now. Show power users and investors where you rank amongst category leaders, and gain early coverage by getting listed today.
Getting on the index
The audit is one-time, $399 (~₦547,822). Twenty verified users are sent through your full signup-to-transfer flow. Full scoring across all five dimensions. Listed in the live index within one week, with a complete audit report covering categorical findings, PC and PP gap analysis, and dimension-level breakdowns. Earned coverage in reputable tech media follows from the listing.
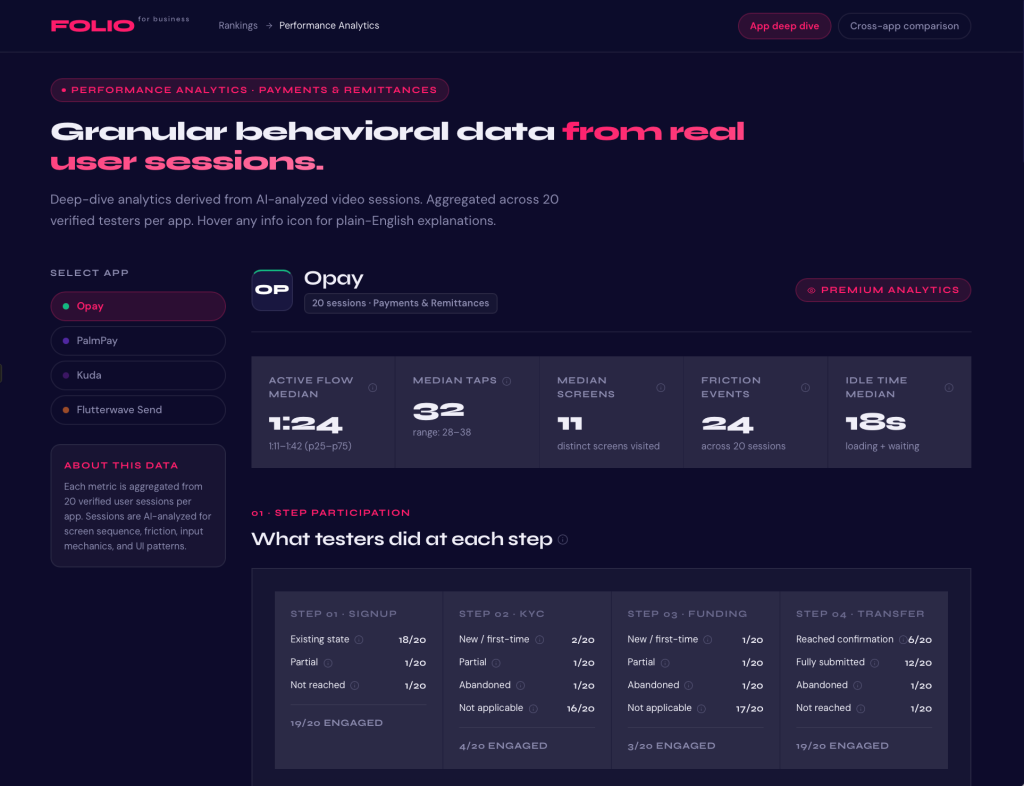
Subscription access at $49 (~₦67,191) per month opens the rest: every app’s full audit data, every category as it goes live, and every score update over time. The premium analytics dashboard adds another layer: granular behavioral data from hundreds of recorded user sessions, with AI-powered video analysis surfacing median screen time, taps per session, friction events, transition timing, and authentication flow patterns. Competitive intelligence that was not available in this category until now.
Scores stay live until the app changes. A re-audit ($350 or ~₦479,941) refreshes the score after a product update.
Tester interviews ($30 or ~₦41,137 per user per session) connect founders directly to the verified users who scored their app, for teams that want to dig deeper than the diagnostic.
Why this matters now
The Performance Index is not built to settle who has the best product. It is built to make the African fintech category measurable, citable, and comparable. Every app is measured the same way. Every score is defensible. Every founder, investor, and journalist who cares about this category now has a single reference point.
The next article like this one will include a new set of apps. To be amongst them, submit to be audited and listed at foliobusiness.com/book-an-audit
If you’re primarily interested in the data, subscribe to the index and the premium analytics dashboard at foliobusiness.com/#pricing
Explore the full Fintech Performance Index at foliobusiness.com/rankings.
Submit to be audited and listed at foliobusiness.com/book-an-audit. Subscribe to the index and the premium analytics dashboard at foliobusiness.com.
About the author
Toju Ometoruwa is the founder of FOLIO, a market research platform with 50,000+ verified users across Africa and the diaspora. Reach him at toju@foliobusiness.com.