Twinpine has released its Kenyan mobile trend report for 2016 and it reinforces what we’ve all known. One – that mobile, like data, is King. And two – that Kenya is not our mate in this tech business. Any forward thinking tech stakeholder that is not developing and optimising for mobile is, like they say, on a loooooong thing.
Let me break it down for you, yeah?
A bit of background
Kenya has a total population of 47.2 million people, and about 89% of them own mobile devices. With about 40% of its population below age 15, I think this is interesting to say the least.
I waited until 16 to get my first mobile device but it seems my Kenyan counterparts are getting theirs at a much younger age.
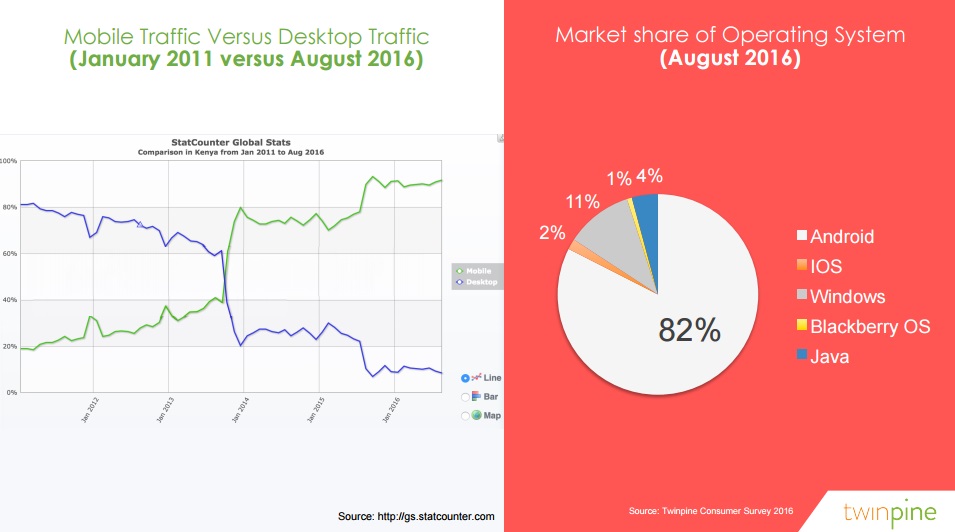
Again, mobile is king. The mobile vs desktop traffic graph looks like a toddler hurriedly scribbled an X and shows desktop use plummeting from a little over 80% in 2011 to about 10% in 2016. In that same period, mobile rose from 19% to 90%.
Android also takes the giant share of the Operating System market, holding 82% of the space as at August 2016 and leaving IOS, Windows, Blackberry OS and Java with the remaining 18%.
The Juice
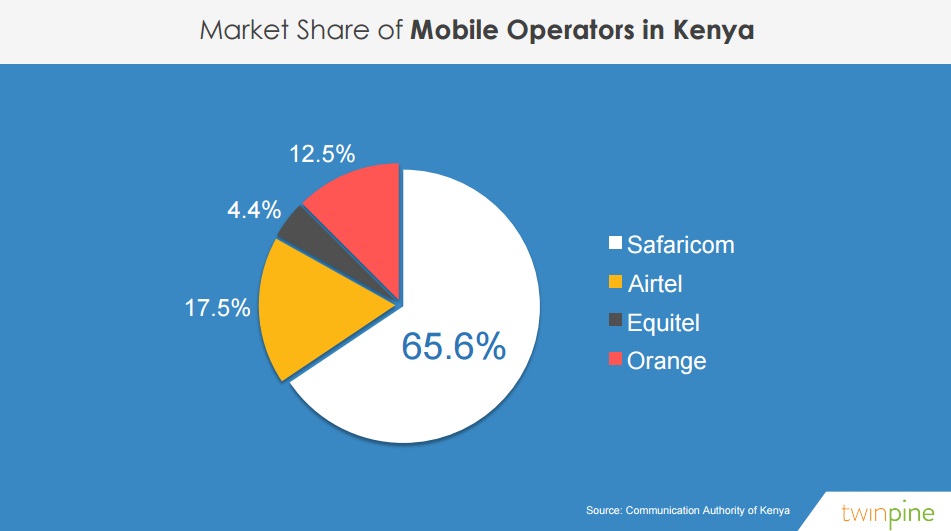
Safaricom maintained its position as the leading mobile operator in Kenya followed (not closely at all) by Airtel Kenya.
Data prices fell.
According to the report, 1000 Kenya Shillings can buy 5x more data in 2016 than it could in 2011.
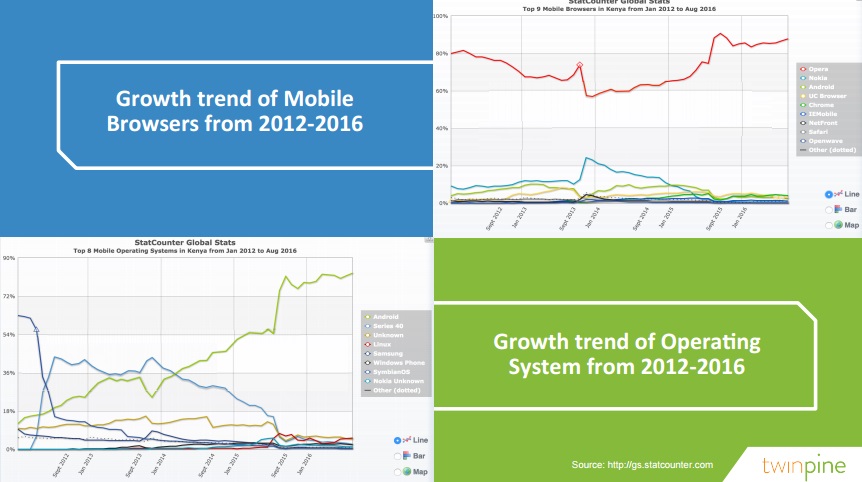
As was the case in Nigeria, Opera left its 8 other competitors behind in the Kenyan mobile browser race.
For the growth trend of operating systems, Android demonstrated its global dominance in Kenya growing from below 18% in 2012 to over 80% in 2016. Linux, Windows phone, Nokia’s Symbian OS and others are all struggling around the 10% mark.
On the social media front, Facebook, the world’s largest social network is also the largest in Kenya. But look at that graph, it’s miles away from Twitter, Tumblr, Pinterest, YouTube, Google+ and StumbleUpon which combine to make up the top 7 mobile social media sites in Kenya.
An unknown player topped the chart for the top 10 mobile device vendors in Kenya from Jan 2012 to Aug 2016. My guess is it’s a combination of several low-end Chinese devices.
Samsung follows with a tumultuous increase from around 15% to about 25% in 2016. The mobile giant definitely had a hard time in the Kenyan market. Huawei, LG, Alcatel, Sony Ericsson (Yes, Sony Ericsson), HTC, Apple and Blackberry all struggle with marginal increase at the bottom of the graph while Nokia continued its free falling trend. Sad stuff.
Twinpine found that Kenyans spend more time on their smartphones than any other device daily. Smartphones take up 193 mins while they spend 131 mins on TV (same as Nigeria). 80 mins on their laptops and 39 mins on tablets. In fact, all the numbers are the same with their Nigerian report. I don’t know about this.
Kenya’s mobile money lifestyle
Mobile money in Kenya deserves its own post, to be honest. According to the IMF, Kenya is one of the market leaders globally when it comes to Mobile Money with a penetration rate of 985 registered mobile money accounts per 1,000 people. I think “one of” should not be part of that sentence but who am I to teach IMF their work?
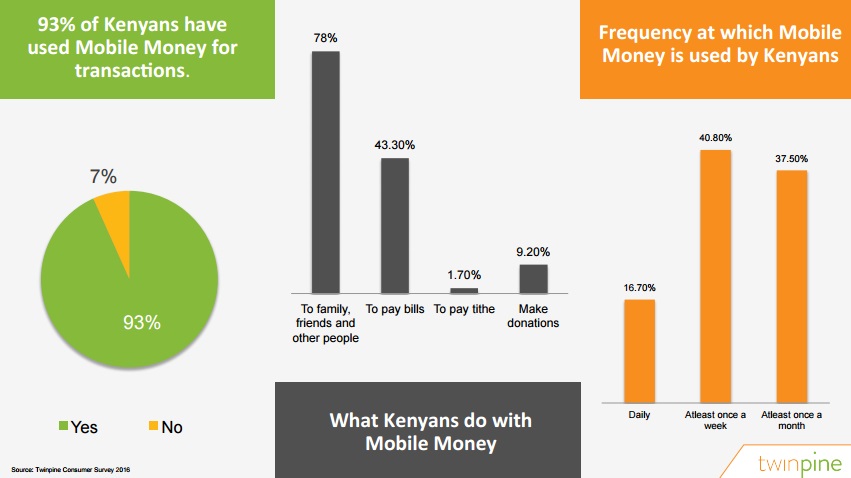
93% of Kenyans polled in Twinpine’s customer survey had used mobile money for transactions. 93 percent! 16.7% use mobile money daily, 40.8% use it at least once a week and 37.5% make up monthly users. Meanwhile, men are 74% more likely to use mobile money than women.
Safaricom’s M-Pesa platform is the obvious crowd favourite, accounting for 84% of mobile money transactions in Kenya (as at Mar 2016). Airtel Money, Orange Money, Equitel Money, MobiKash and Tangaza are the other players sharing the remaining 16% of mobile money users in Kenya.
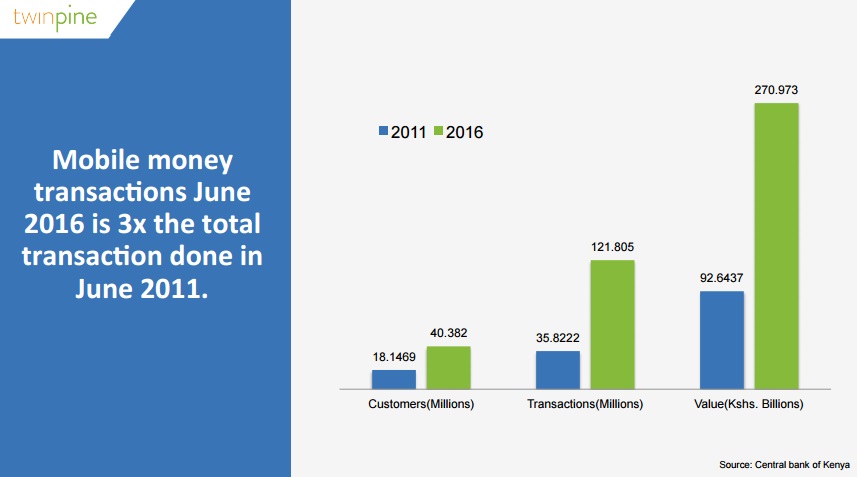
Mobile money transactions in Kenya as at June 2016 are 3x what they used to be in June 2011.
Fun fact: As at October 2011, M-Pesa had processed more transactions within Kenya than Western Union had processed globally, earning its place as the world’s most successful mobile payments system.
Media and Shopping
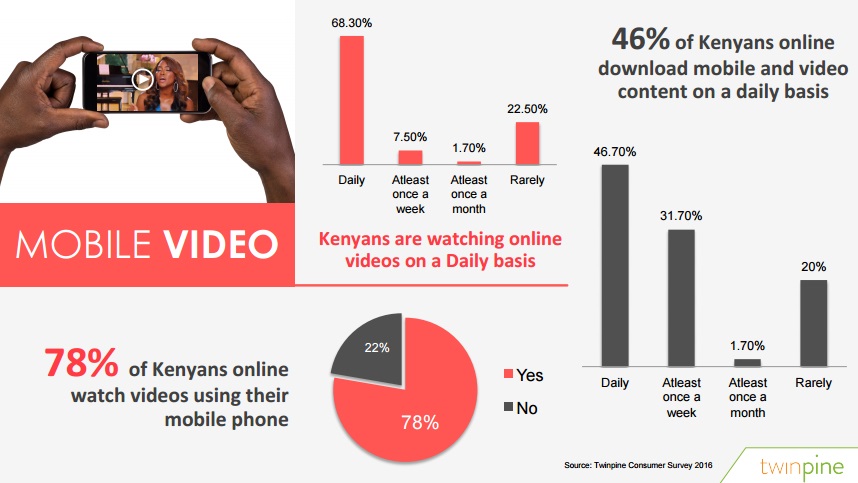
68% of Kenyans online consume video content on a daily basis. I’m willing to bet a large proportion of this video is from their Facebook wall. Mobile video downloads, on the other hand, sit at 46.7% daily, 31.7% at least once a week and 1.7% at least once a month while 20% rarely download video online.
Numbers in online shopping are quite surprising to me, only 42% of Kenyans online have shopped online before. As is to be expected, 67% of online shoppers research on a product before buying while brave souls (33%) shop online without conducting research.
That’s all folks!
You can read the full report here.


