This serves as a follow up to our previous post on Nigeria’s mobile marketshare. You should read it first (if you haven’t) for context.
In 4 revealing graphs, we saw how Nokia is losing its grip while Samsung is barely getting by. Tecno on the other hand continues to win the hearts of Nigerians. We thought it would be interesting to observe what the trend is like on the rest of the continent.
According to statcounter, Nokia and Samsung appear to be the leading mobile phone brands in Africa at the moment, as depicted in the map below.
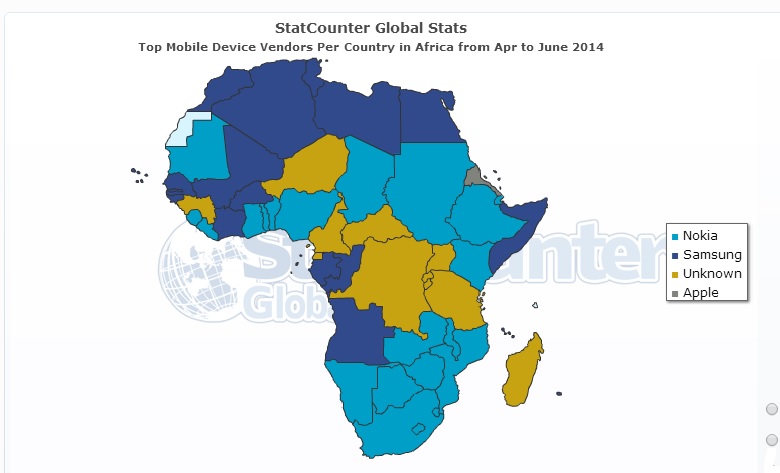
We have to remember that stacounter only gives a general overview of the space, based on analysing traffic to its member sites. The data represented on the map covers 4 major mobile platforms – Nokia, Samsung, Apple and “Unknown” – from April to June 2014.
As we have explained earlier, we believe the “unknown” OEM category definitely references myriad smartphones of mostly Asian origin that are increasingly becoming popular in the region but don’t officially register on Statcounter’s database. The biggest of these is indisputably the Tecno brand.
If the data is anything to go by, Nokia devices still account for a huge swathe of the African mobile phone market. This is in spite of its steady decline over the past 3 or more years. On the other hand, the Samsung continues to grow and is catching up to Nokia.
Nokia, recently acquired by Microsoft, seems to have the whole of Southern Africa in its pocket, though it’s a very close rivalry between Nokia and Blackberry (28.08% vs 25.9%), in South Africa, and Nokia and Samsung (36.9% vs 36.74%) in Namibia.
In North Africa, it is essentially a two-horse race between Samsung and Nokia. The story is almost the same for West Africa, save for the fact that the unknown brands have managed to garner a healthy chunk of the market share. Again, Tecno.
Here’s something interesting. With just over 40 percent share of the market, Apple is the dominant brand in Eritrea. We’re not sure why this is the case. Everywhere else, Apple’s indicators are much more familiar, often struggling to break into the 1 percentile.
Finally, in East and Central Africa, the unknown brands seem to be scooping up whatever marketshare Nokia is shedding.
Here’s a break down of the dominant brands and corresponding marketshare in each country:
Nokia
Nigeria – 48.59%
Chad – 43.17%
Benin – 30.67%
Togo – 22.65%
Ghana – 28.12%
Liberia – 29.74
Sierra Leone — 42.38%
Mauritania – 36.34%
Sudan – 53.65%
Ethiopia – 48.28%
Djibouti – 53.83%
Kenya – 38.09%
Namibia – 36.9%
Botswana – 55.58%
South Africa – 28.08%
Zambia 36.9%
Zimbabwe 46%
Malawi – 49.87%
Mozambique – 48.77%
Samsung
Angola 20.48%
Congo – 29.13%
Gabon – 34.28%
Ivory Coast – 27.81%
Burkina Faso – 37.44%
Mali – 34.15%
Guinea-Bissau – 26.4%
Senegal – 32.55%
Cape Verde – 24.66%
Morocco – 50.25%
Algeria – 39.92%
Tunisia – 34.28%
Libya – 49.97
Egypt – 48.59
Somalia – 39.29%
Comoros – 36.13%
Sao Tome & Principe – 26.2%
Mauritius – 29.11%
Unknown
Madagascar – 39.92%
Tanzania – 42.22%
Burundi – 35.26%
Rwanda 55.26%
Uganda – 39.89%
DRC – 29.04%
Central African Republic – 39.86
Equatorial Guinea – 34.6%
Cameroon – 34.05%
Guinea – 53.43%
Niger – 30.55%
Apple
Eriteria – 40.13%
Photo Credit: World Bank Photo Collection via Compfight cc